Analytics
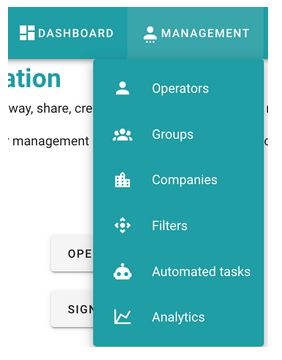
Access to the dashboard menu with representative graphs is done through the top menu ‘MANAGEMENT’:
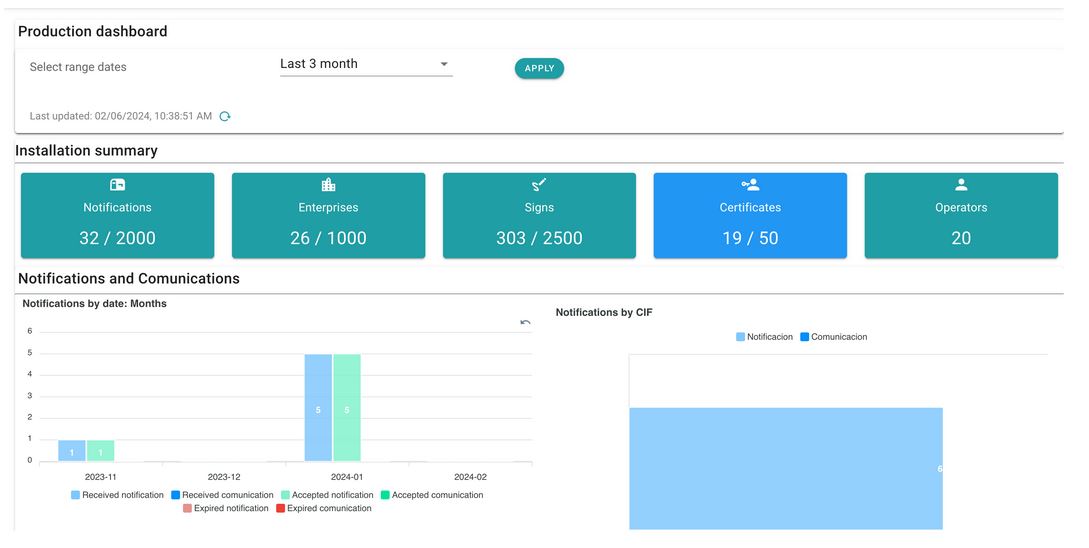
GoodOK has a Dashboard with representative graphs about notifications, signatures, and data associated with operators.
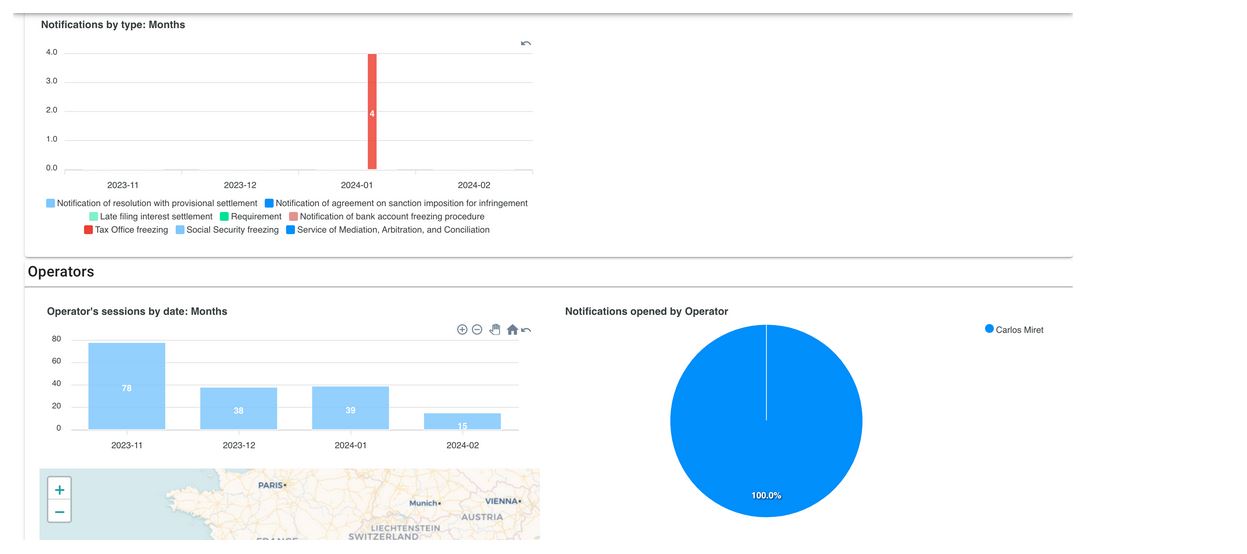
In the case of operators, we can obtain connection location, metrics of notifications opened per operator, specifying the operator for which we want to perform this search, etc.
Newsletter susbcribe
Receive all the news and updates about GoodOK in your email.